Posted: Updated:
Print Article
At BuzzSumo, we've analyzed the social share counts of over 100 million articles in the past right months. So it's fair to say we have a pretty good idea of what gets shared the most.
There's always been some nagging questions that we've wanted to answer. We came up with this set of questions, hoping to challenge popular assumptions on how to make your content go viral:
- What types of emotions did the most popular articles invoke?
- What type of posts typically receive a lot of shares? (lists? infographics?)
- Did readers love to share short form or long form content? What's the ideal length?
- Does trust play a major role on whether someone will share an article?
- What's the effect of having just one image in a post vs no images?
- What's the effect of having just one influencer sharing your article vs 0?
- How do we make people share our post days and even weeks after it's been published?
- What's the best day of the week to publish an article?
Of course, the prerequisite to getting your content shared widely is to write compelling content.
There's just no replacement for that. But once you've written a well-crafted, useful article, there are some additional things you can do to help increase its reach.
Here are 10 ingredients that will help increase the shareability of your content:
1) Long form content gets more social shares than short form content.
We've all heard stats on how more people are consuming content through their mobile devices. Which means we better write short, bite-sized content to satisfy their short attention spans, right?
We analyzed the top 10% most shared articles to see if this was the case. And according to our research, the opposite is true. On average, long-form content actually gets shared more than short-form content.
If you look at the chart below, the longer the content, the more shares it gets, with 3,000-10,000 word pieces getting the most average shares (8859 total average shares). Not surprisingly, there was a lot more short-form content being written. How much more? There were 16 times more content with less than 1000 words than there were content with 2000+ words.
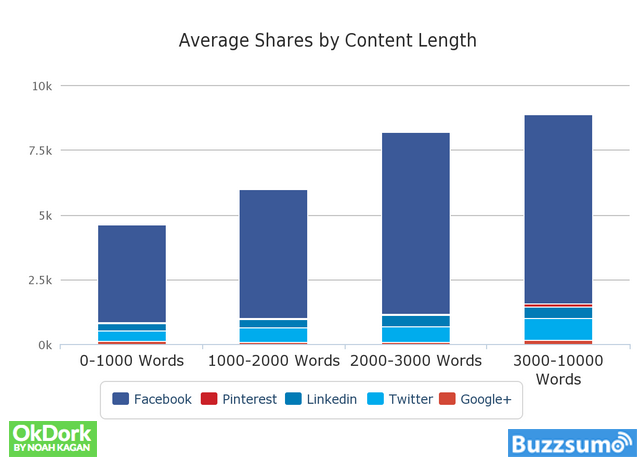
What does this tell us? It tells us that most people just aren't willing to create in-depth, well-researched articles packed with insights. They just don't want to put in the time and effort. Which means there's probably a lot more opportunities for you to do so. Because there just isn't as many long-form content creators to compete with.
Our findings were consistent with what researchers discovered about the most emailed posts in The NY Times: longer articles were more likely to be emailed than shorter articles.
The fact is that, yes people love to share LOL cat pics and funny memes, but they also want to share intellectually challenging, long-form content. Since the web is inundated with the former, you're better off spending your time writing that one epic piece of content instead of writing lots of short, fluffy pieces.
There's just less competition, and as a result, it's easier to stand out.
Key Ingredient: Aim for at least 2,000 words per post.
2) Having at least one image in your post leads to more Facebook shares
We've all hear experts tell us visually compelling images increases engagement, but that only applies to social posts on Facebook, right? What about actual written content?
This time, we analyzed all the articles we've crawled in BuzzSumo to compare the average number of Facebook shares of content with 1+ images to content with 0 images.
The following chart shows our findings:
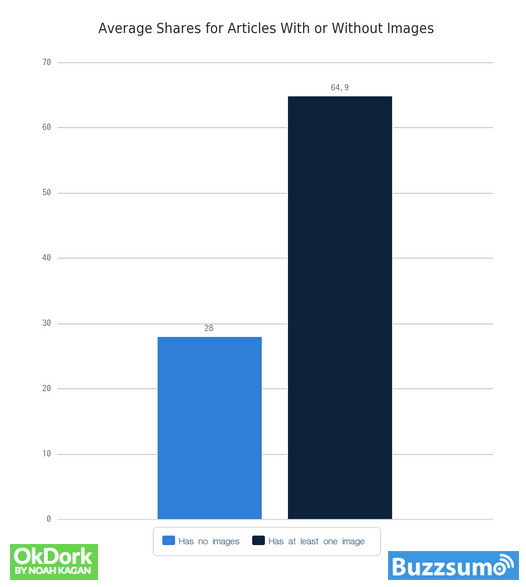
As you can see, twice as many people, on average share posts with at least one image in the post, underscoring the importance of having visual elements mixed in with bodies of text. Keep in mind though, we didn't do any analysis on how visually appealing these images were, just the presence of an image.
What about social meta tags for Facebook? We were curious whether publishers that implemented these tags, specifically the preview image received more Facebook shares, on average. Again, we'd expected this to be true, but we wanted to see how dramatic this difference was. By the way, for those not familiar, if you wanted Facebook to show a specific preview image, you'd need to implement this meta tag in the section of your article:
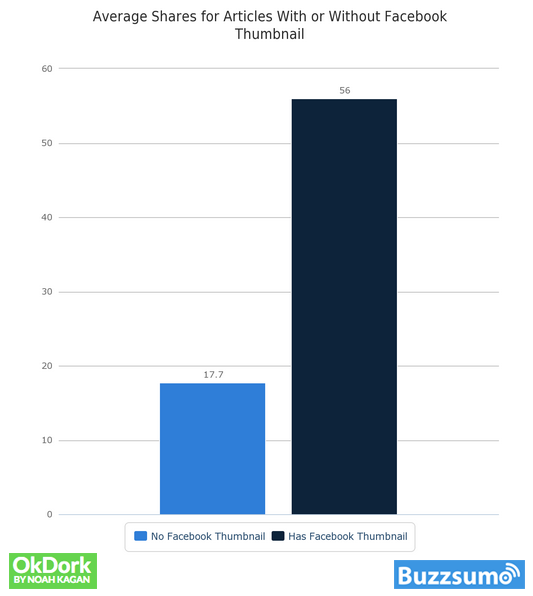
As you can see, articles that implemented the Facebook preview image meta tag had more than three times as many Facebook shares + likes than those that didn't.
Key Ingredient: Implement those social meta tags and add a photo to EVERY post! They determine what potential readers see before they even visit your article.
3) Having at least one image in your post leads to more Twitter shares
Perhaps unsurprisingly, the same above is very much true for Twitter as well. Posts with the OpenGraph image tag did substantially better on Twitter than those without:
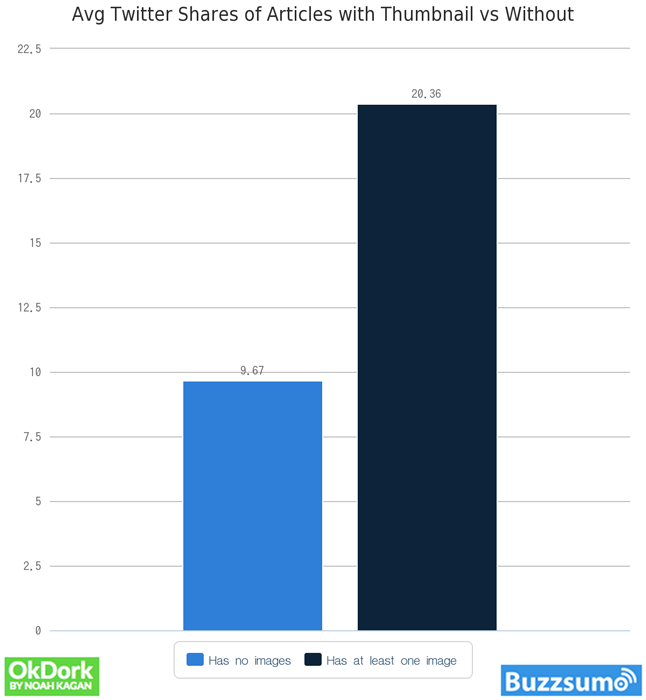
Key Ingredient: Adding images to your content and posts will help it get shared on Twitter as well as Facebook!
4) Invoke awe, laughter, or amusement. Appeal to people's narcissistic side
We analyzed the top 10,000 most shared articles across the web, and mapped each one to an emotion, such as joy, sadness, anger, amusement, laughter, etc. Here is how the breakdown of emotions looked like:
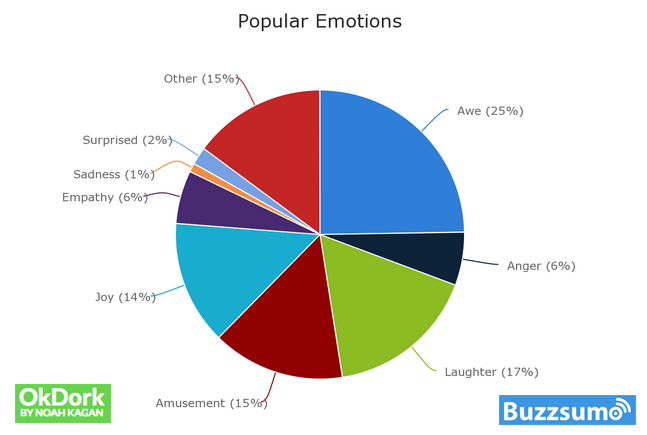
- awe (25%)
- laughter (17%)
- and amusement (15%).
*Note the difference between laughter and amusement were blurry at times, but we define amusement as being entertained, and not laugh out loud funny
Why do people share things that inspire awe, laughter and amusement? We don't have a scientific reason for it, but The New York Times did a very intensive research study a few years back. They interviewed 2500 people to determine the primary reasons they shared a story online. These were the main reasons:
-To bring valuable and entertaining content to one another
-To define themselves to others (give people a better sense of who they are)
-To grow and nourish relationships (stay connected with others)
-For self-fulfillment (to feel more involved in the world)
-To get the word out on causes they care about.
Awe-inspiring and funny content definitely fulfill the first three reasons. Sharing entertaining content brings value to our friends, shows others we have great taste, and spurs conversation and reactions.
People also share for selfish reasons, like narcissism.
In fact, eight of the top 10 most shared articles in the past eight months were quizzes (seven from BuzzFeed, one from the NY Times). Why quizzes? Because when we share our quiz results, it fuels our identity and ego. Others will learn more about who we are, what we value, and our tastes. Think about the last time you shared a quiz. Do you really think 90% of your Facebook friends actually care? No, but the few that do will know what a cool person you are. Similarly, sharing an opinionated piece about a hot issue, such as gay marriage lets others know where we stand on the issue.
For reference, here were six of the 10 most shared articles in the past eight months, with the quiz 'What Career Should You Actually Have' in the #1 spot.

Key Ingredients:
-Be entertaining... nobody wants to bore their friends.
-Quizzes work... people share content that helps them identify who they are.
-Have an opinion... being controversial may divide the crowds, but those who agree with you are more likely to share your content.
5) People love to share lists and infographics
We also set out to see what content formats people were more likely to share. So we classified each article in our analysis into six types:
We also set out to see what content formats people were more likely to share. So we classified each article in our analysis into six types:
- lists
- infographics
- how to articles
- what posts (articles whose title started with the word 'What')
- why posts (articles that tried to answer a 'Why' question)
- videos
- infographics
- how to articles
- what posts (articles whose title started with the word 'What')
- why posts (articles that tried to answer a 'Why' question)
- videos
Here is a chart with our findings:
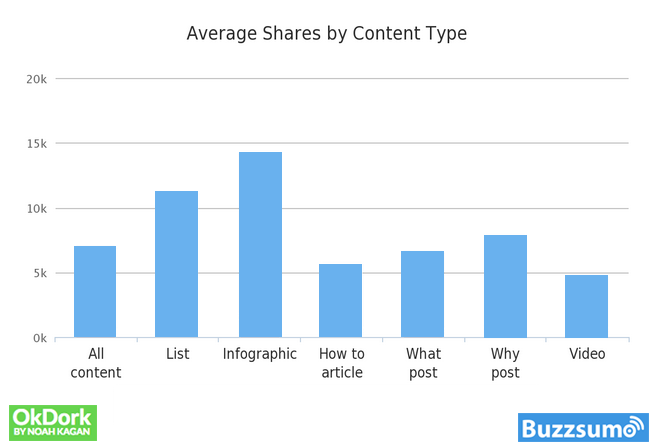
*Note: All Content is the average shares of all content we analyzed, and is meant to be a benchmark.
This may be obvious to some, but list posts and infographics receive more average shares than other content types.
More surprisingly, how-to posts and videos receive less shares than the average post.
There are many possible reasons why list posts get shared the most. Lists give the readers an exact idea on what to expect (i.e. 10 ways to do something). They're also skim-friendly and easy to read.
Similarly, infographics make it easier to digest a huge amount of information in a visually appealing way. So make sure your content has plenty of images or charts, so readers aren't intimidated by so much text.
Key ingredient: If you're writing long-form content, remember to keep it easier to scan, and not a wall of text. Structuring it as a list post is a simple way to do that, but if you're not writing a list, make sure you write easy to read paragraphs, and use sub-headlines and bullet points.
6) 10 is the magic number for lists
This was not surprising: 10 item lists on average received the most social shares -- on average 10,621 social shares. In fact, they had four times as many social shares on average than the second most popular list number: 23. The runner-ups were 23, 16, and 24.
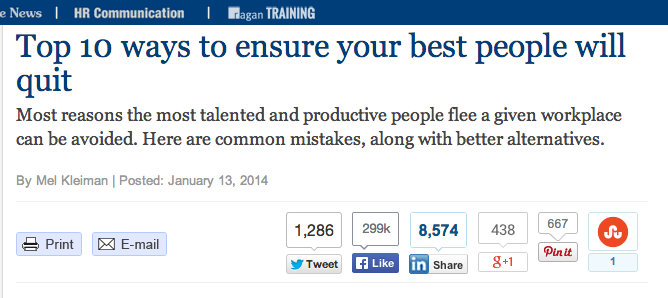
Key Ingredient: If you're writing a list post, try to round it up or down to 10 items.
7) People tend to share content that looks trustworthy
We were curious to see if trust played a role on whether someone would share an article. So we compared the average social shares for articles with no byline or bio, and articles with a byline or bio.
We were curious to see if trust played a role on whether someone would share an article. So we compared the average social shares for articles with no byline or bio, and articles with a byline or bio.
It turns out that trust does play a major role in Twitter, Linkedin , and Google+, as you can see from the chart below.
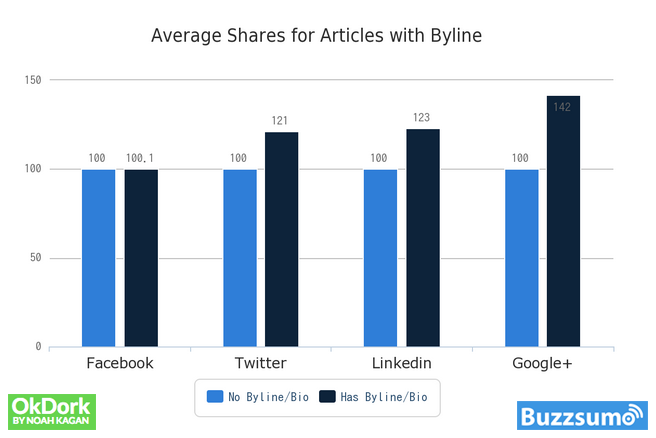
The numbers are normalized below to 100, as the absolute numbers aren't important, just the difference.
However, trust doesn't seem to make a difference in Facebook. Articles with a byline or bio have 0.10% more social shares than those without a byline/bio. In contrast, in Google+, articles with a byline/bio have 42% more social shares than those without a byline or bio.
The fact that trust doesn't play a major role in Facebook suggests that we share different types of content in each social network. We usually sharing entertaining, funny content on Facebook with our close friends.
But on Twitter, Linkedin, and Google+, most of our followers are people we are associated with professionally. So we prefer to share content from a trustworthy source to build our thought leadership.
Key Ingredient: Remember to have a byline at the beginning of every post, and a bio at the end to make your content look trustworthy.
8) Getting one extra influencer to share your article has a multiplier effect.
Not all sharers are created equal. After all, if Oprah or Tim Ferriss shared your article with their followers, it will generate much more retweets/likes than if a random person shared it.

But can we quantify that effect? Forget Oprah or even Tim Ferriss. What if someone a bit more influential than the average person shares your content? How many more additional people will share it as a result of that? Can we predict that?
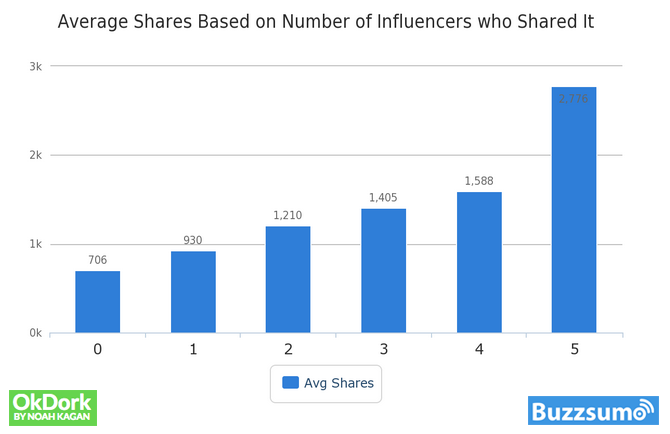
We compared the number of social shares of articles that had 0 influential sharers to content that had > 0 influential sharers.
To formalize things, we define 'influencer' as someone whose tweets are retweeted on average two times. For instance, if you tweeted 100 times total, and 200 people retweeted those tweets, the average retweets would be 2.0 (This sounds like a low number, but for comparison, someone like Noah Kagan has an average retweet of 4.5)
As you can see from the chart below, just having one influential person sharing your content resulted in 31.8% more social shares. Having three influential people sharing your content doubled the number of social shares. And having five influential people sharing your content almost quadrupled the total number of social shares for an article.
That's great, but how do you get more influencers to share your content without relying on blind luck?
One way is to work backwards. Instead of writing your content first, find a piece of content that is similar to the one you want to produce, and see all the influencers that shared it. Then start building a relationship with those influencers before you launch your post.
For instance, let's say you want to write an article about 'conversion optimization'. With BuzzSumo, you can find the most shared articles on conversion optimization in the past 6 months using the Top Content Search.
You'll see a list of results like below:
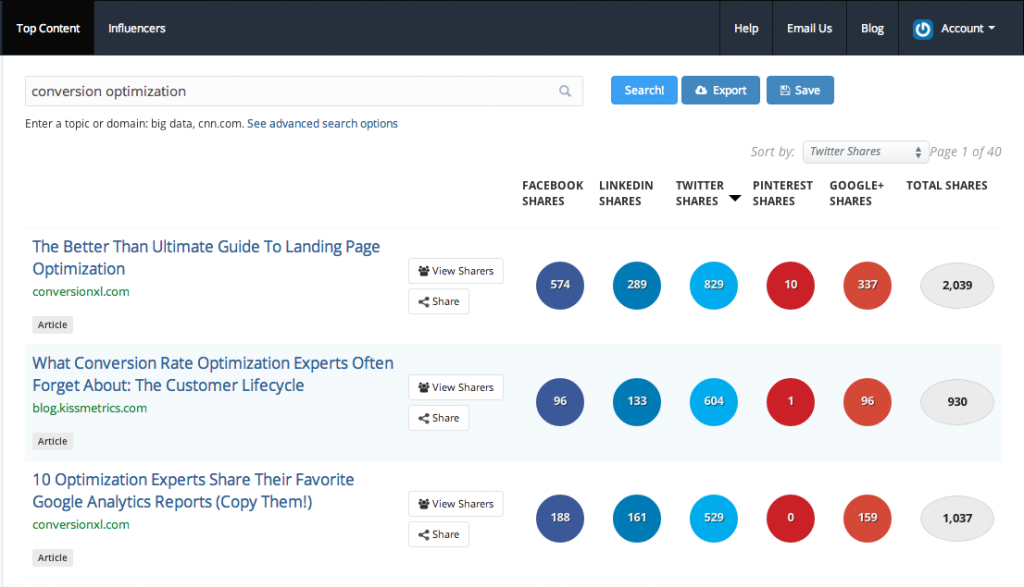
The first result has 2,039 shares, and is from conversionxl.com. You can see who shared this article by clicking on the 'View Sharers' button. There you'll see a list of people who shared this article on Twitter, sorted by average retweets. In other words, it's sorted by their influence level.
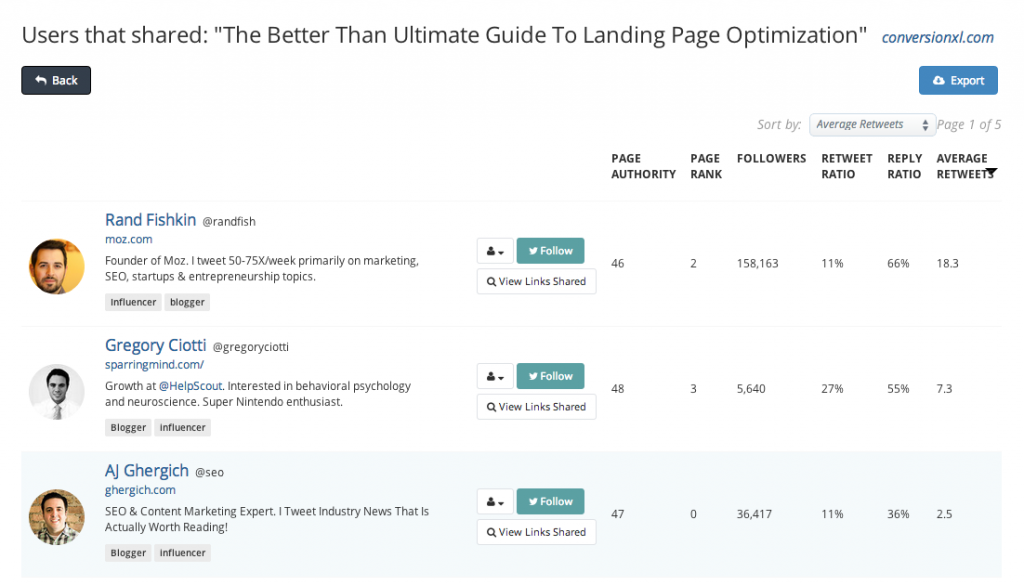
There are a couple of other useful fields you'll see for each sharer, including the number of followers they have, and their reply ratio (% of tweets that are direct replies to someone). While number of followers is a more common metric people use to measure influence, it can easily be faked. Average retweets on the other hand, is very hard to fake (or not as likely).
You probably have to do this for more than one article to compile a list of influencers you want to share your content, but once you have this list, you should try to reach out to each of them and get them involved in your content in some way such as:
-Asking them for a quote you'll use in your article
-Asking them a question to get feedback on an idea
-Linking to something they wrote about your topic.
People love to share things they've been involved in, even if they weren't involved in it directly. If you can do that somehow, they'll more likely to share your article with their followers after you've published it.
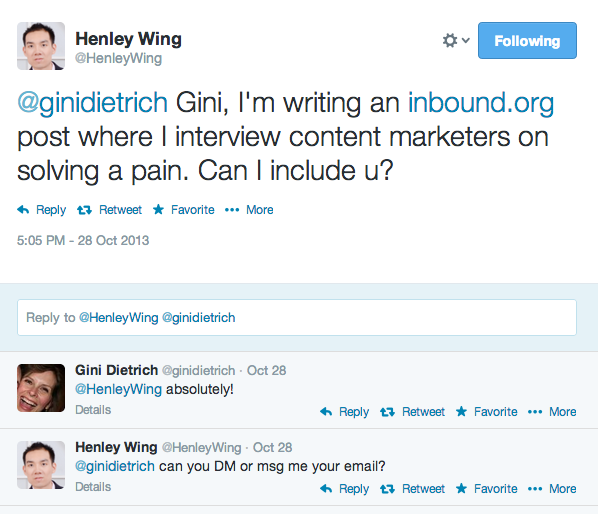
Interviewing people can also be a great way to get them involved. At BuzzSumo, our most shared blog post had over 500+ shares. We interviewed over 40 people in the SEO industry and everyone of those interviewees shared their post with their audience. Here's a screenshot of a tweet we sent asking people if they'd like to be interviewed. Most of the responses were very positive.
Key Ingredient: Incorporate and ask influential people into your content to significantly increase your sharing.
9) Re-promote your old content on a regular basis.
The next thing we analyzed is the % drop in social shares after you've published your post for 3 days. Most people will share your post in the first few days, and then those shares will taper off, but by how much?
The result was rather depressing. After 3 days, on all social networks, the number of shares dropped at least 96% for the next 4 days, with Facebook shares dropping the most, and G+/Pinterest dropping the least.
Facebook: 98.9% decrease
Twitter: 97.4% decrease
LinkedIn: 97.34% decrease
G+: 96.7% decrease
Pinterest: 96.7% decrease
Twitter: 97.4% decrease
LinkedIn: 97.34% decrease
G+: 96.7% decrease
Pinterest: 96.7% decrease
After a week, the number of shares for the next 3 weeks drops at least 86% from the first week, with Twitter shares dropping the most, and Linkedin shares dropping the least.
Twitter: 92.1% decrease
G+: 90% decrease
Facebook: 89% decrease
Pinterest: 86% decrease
LinkedIn: 82% decrease
G+: 90% decrease
Facebook: 89% decrease
Pinterest: 86% decrease
LinkedIn: 82% decrease
This is inevitable, right? Well, we decided to analyze the anomalies - the articles that actually had more social shares after a week had passed, and see how they pulled off such a feat.
One of those articles was a blog post by Evernote published on March 10th that only garnered 23 facebook shares after a week. However, after a month, it had a total of 181 shares, an increase of 686% after 3 days.
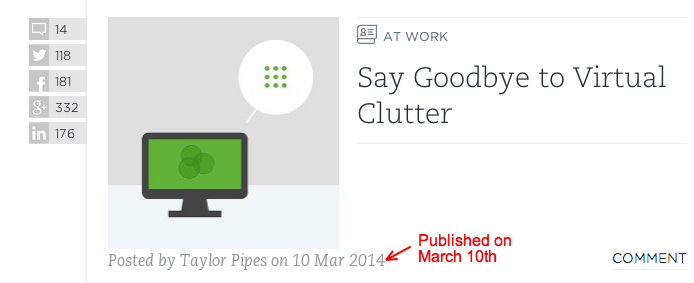
After doing some digging up, we saw the reason why: they repromoted that post 11 days on Facebook after it was published, as you can see below:
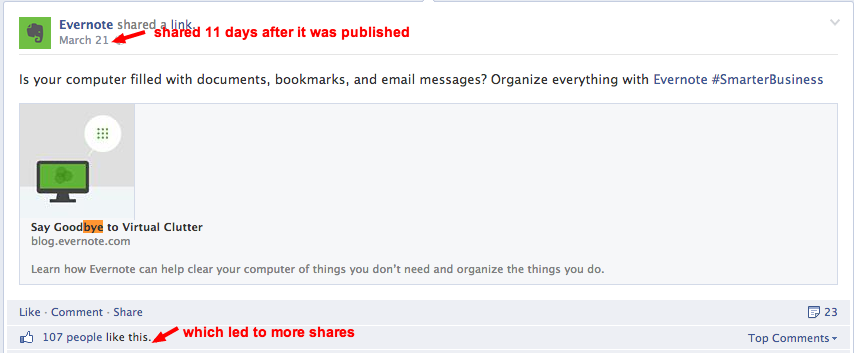
We don't have any hard data on the ideal time period to wait before promoting an article again, but at least one week is a good starting point. Here, Evernote published their piece on a Monday, and promoting it on a Friday the next week. A solid strategy would be to promote pieces you write on Friday and weekends on a more popular day like Monday a week later. This will ensure all your posts get the same amount of exposure.
Of course, a prerequisite of this is to write evergreen content, since it can be shared and re-promoted anytime after you've published it.
But what if your old posts aren't evergreen? There's still a way to promote old posts if it ties into an upcoming event. For example, we found an infographic about influencers to meet in SMWW (a social media marketing conference) that had 72 twitter shares after a week, but 487 whopping Twitter shares after a month. What was their secret?
The infographic was published initially on March 10th, and then shared again on Twitter the day of the conference: March 28th. This timely share dramatically increased the number of Twitter shares.

Key Ingredient: Don't let your content be a 1-hit wonder! Repromote your old posts at least a week after it's been published. Alternatively, find old content that ties into an upcoming event/holiday, and repromote that the day of the event.
10) The best day overall to publish content for social shares is Tuesday
The day of the week you publish your content on can have a big effect on how much it is shared. Take a look at the chart below, showing the number total shares by day of week for all the content we analyzed:
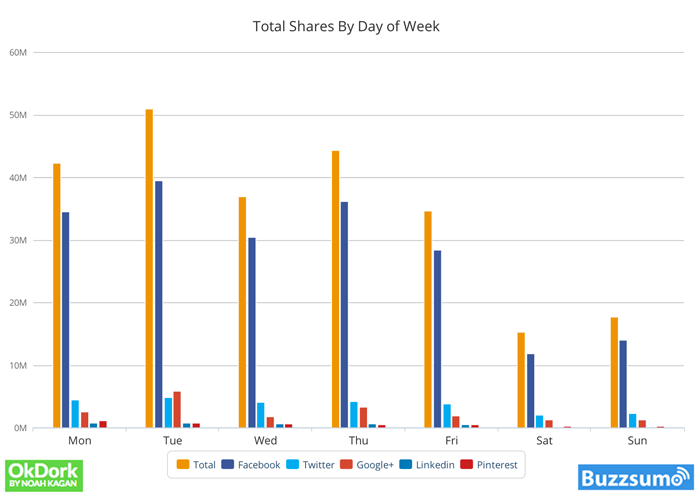
You can clearly see that more content is shared during the week, with the start of each week seeing the highest volume of shares. Generally content gets the most shares on Tuesday or Monday, depending on the social network:
Best Day Overall: Tuesday
Best Day For FB: Tuesday
Best Day for G+: Tuesday
Best Day for Twitter: Tuesday
Best Day for Linkedin: Monday
Best Day for Pinterest: Monday
Best Day For FB: Tuesday
Best Day for G+: Tuesday
Best Day for Twitter: Tuesday
Best Day for Linkedin: Monday
Best Day for Pinterest: Monday
Conclusion
To summarize, here are some data-driven insights you should be aware of when creating highly shareable content:- Inspire awe, laughter, or amusement.
- Appeal to people's narcissistic side (think BuzzFeed quizzes)
- Long-form content has less competition, and more shares on average.
- List posts and infographics are more likely to be shared.
- Make sure your article inspires trust. Have a byline, and bio. Make sure you have a professional logo and design as well.
- Mix text with visually appealing elements.
- Implement social metadata such as the Facebook preview image
- Reach out to influencers before you write your content.
- Promote your articles after it's been published for a week
- Tuesday is the best day to publish and promote content
Of course, some things do depend on your niche. If your audience really is into LOLCat pics, writing long-form content probably isn't worthwhile.
If you really want to see what content resonates for your target audience, I recommend doing a BuzzSumo search on your topic/industry, and see what types of posts get the most social shares.
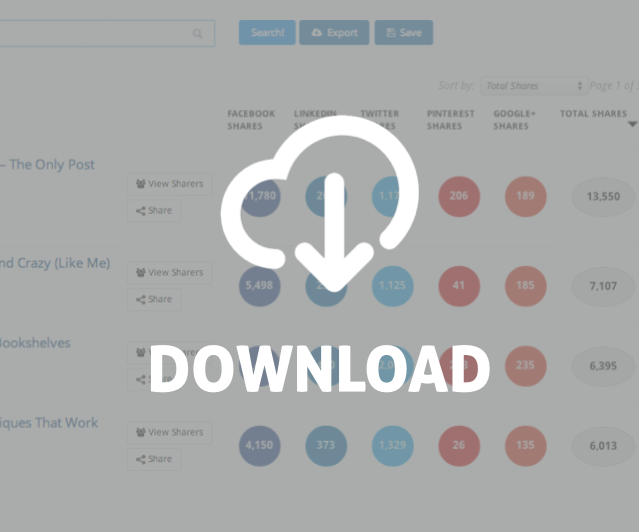
You can even do a search for your competitor's domain, to see what types of content gets shared the most for your competitor. For example, here's what the most shared posts for Tim Ferriss' blog looks when you enter fourhourworkweek.com:

Noah Kagan is the Chief Sumo of AppSumo.com, the free newsletter to help entrepreneurs kick more ass. Grab his free marketing newsletter on how he grew AppSumo to 700,000+ subscribers. Or, download his story of losing $170,000,000 from getting fired at Facebook.
Follow Noah Kagan on Twitter: www.twitter.com/noahkagan
No comments:
Post a Comment
Note: Only a member of this blog may post a comment.